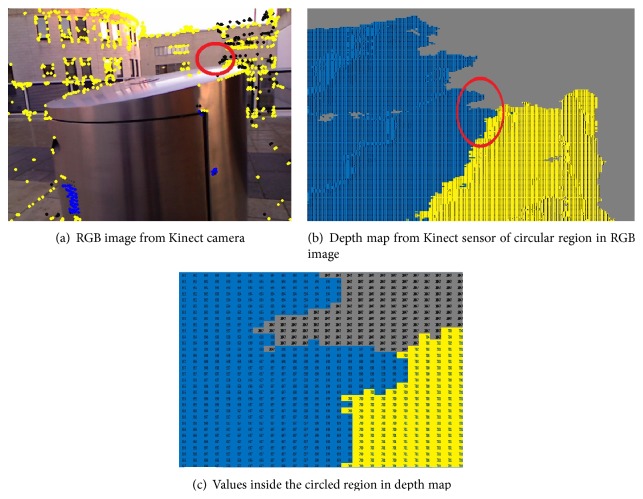
Figure 5.
Kinect output: an RGB image and its corresponding depth map; colours in the depth estimated map represent distance from the sensor based on distance threshold: green color shows possible hazard, whereas blue color represents potential hazard and black points are the areas from which the sensor is unable to get sensible depth and the values are 2047.

