Figure 13.

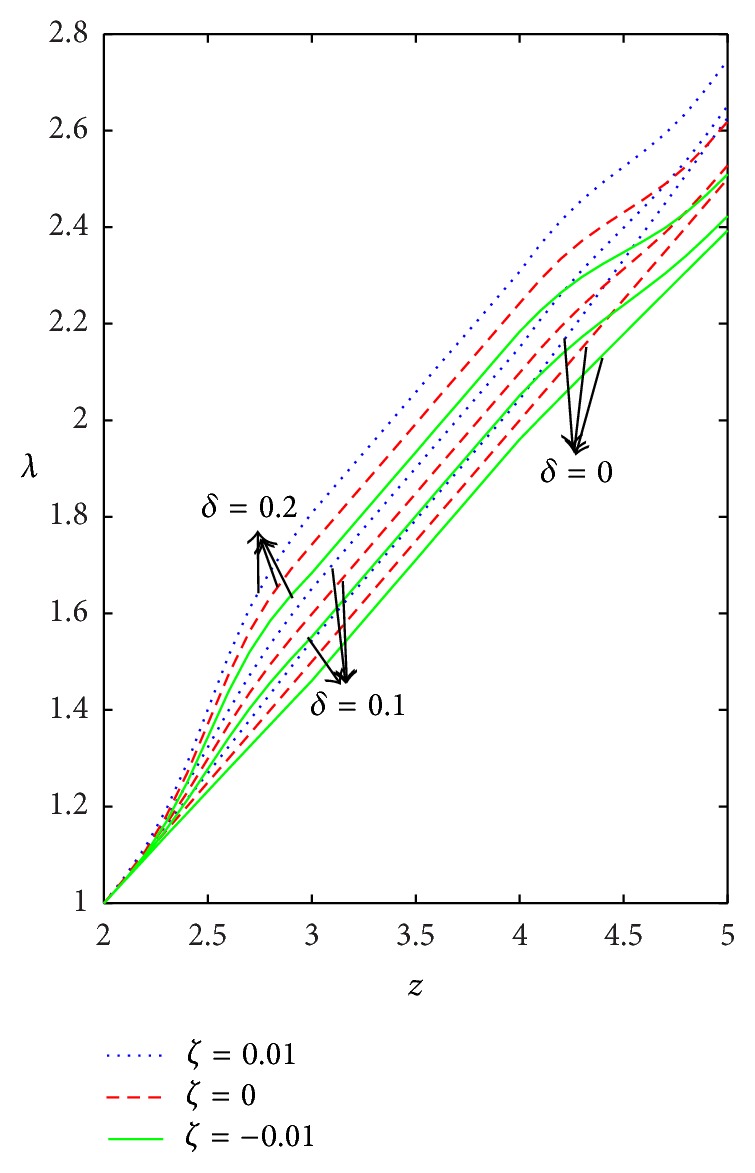
Variation of flow resistance (λ) with respect to axial distance for different values of δ taking n = 0.8, k = 1.2, and τ y = 0.1.

Variation of flow resistance (λ) with respect to axial distance for different values of δ taking n = 0.8, k = 1.2, and τ y = 0.1.