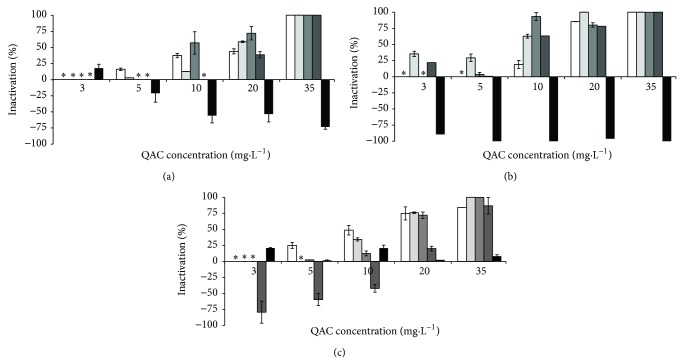
Figure 2.
Inactivation of P. fluorescens by BAC (a), CTAB (b), and QAC combination (c), where solid white box is the control (no interfering substances), light grey box corresponds to BSA, grey box is ALG, dark grey box is YE, and black box is HA. ∗ means no inactivation. Values below zero are indication that the metabolic activity increased in comparison with the control experiment. Mean values ± standard deviation for at least three replicates are illustrated.

