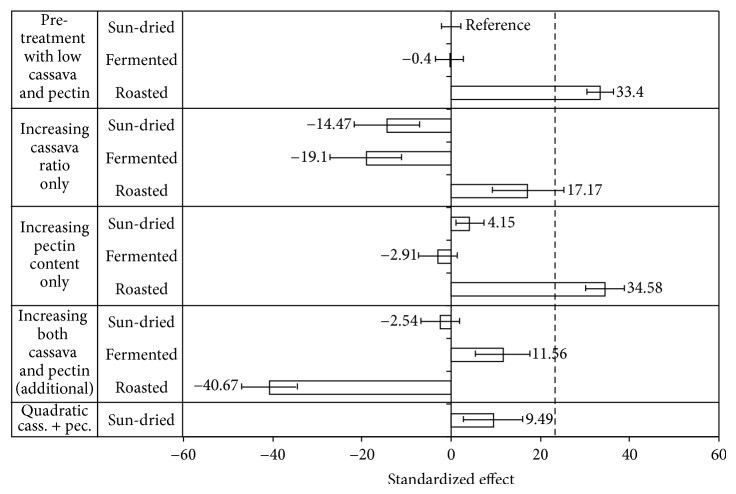
Figure 3.
Modified Pareto chart showing the relative effects of pretreatments, flour composition factors, and the interaction of these on brownness according to the regression model (R 2 = 0.93). Bread made with sun-dried flour with low cassava and low HM-pectin contents was set as reference bread. The brownness index of wheat bread is indicated by a dotted line. Effects with error bars not including point 0 are statistically significant at 95% confidence level.

