
Figure 3.
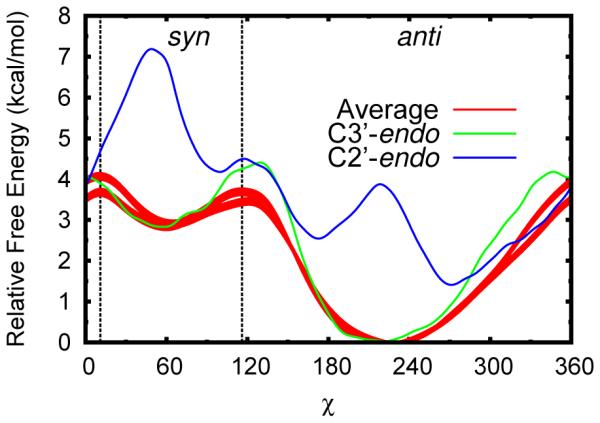
Free energy profiles for solvated uracil along its χ torsion using multiple schemes to reduce dimensionality. The whole data set can be used by taking the Boltzmann weighted average for all sugar pucker values (red, two curves corresponding to two statistically equivalent data sets with 95% confidence intervals). Conversely, fixed pairs of Zx and Zy can be followed, in this case corresponding to the average C2′-endo (blue) and C3′-endo (green) minima (see 4).