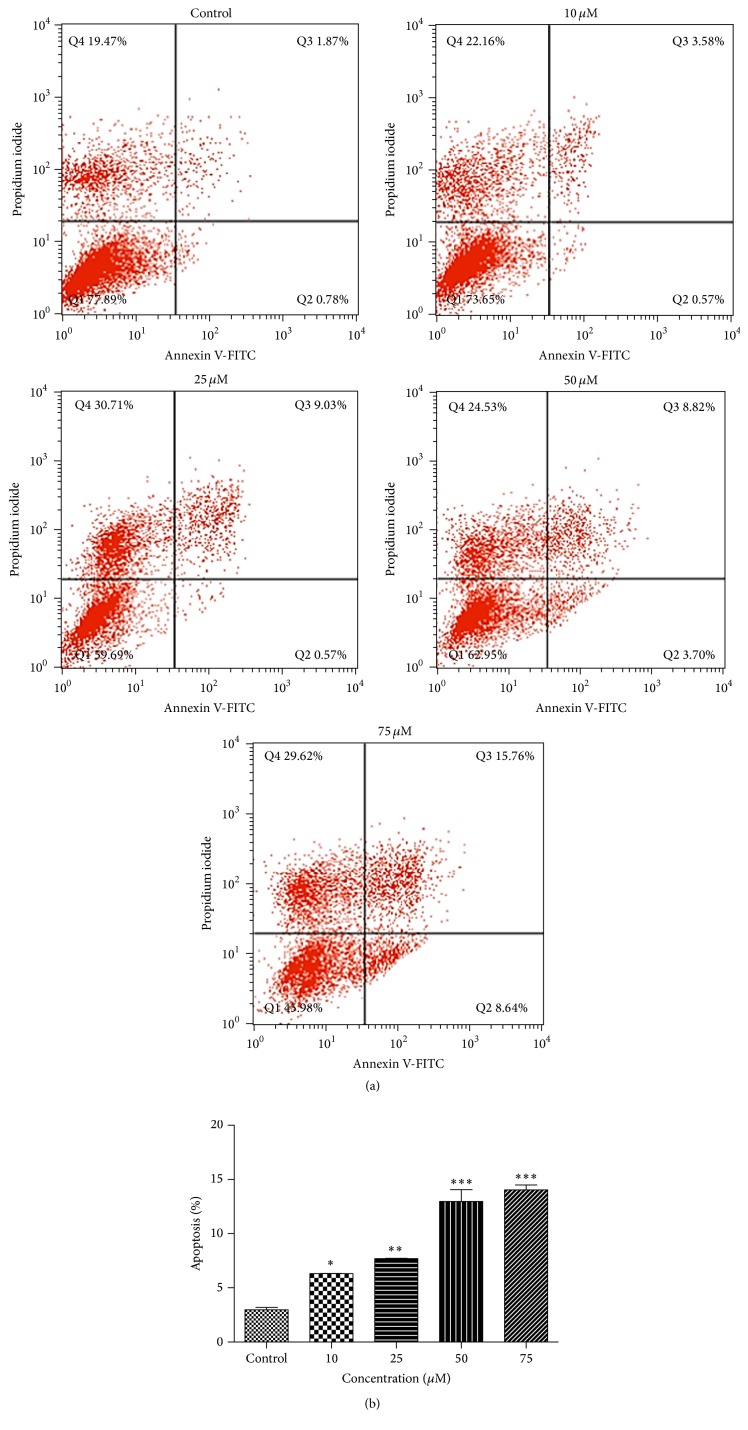
Figure 2.
Flow cytometric analysis of quercetin-induced apoptotic cell death in B-CPAP cells. Cells were treated with different concentrations of quercetin (10–75 μM) for 24 h. Apoptosis was evaluated using Annexin V-FITC and PI staining followed by flow cytometry (a). Cells in the lower left quadrant (Annexin V-FITC−/PI−) are viable; those in the lower right quadrant (Annexin V-FITC+/PI−) are early apoptotic and those in the upper right quadrants (Annexin V-FITC+/PI+) are late apoptotic or necrotic. Apoptosis bar graphs (b) represent mean ± SD, n = 3. Differences between means and significance of the treatments were analyzed using ANOVA and Tukey's multiple comparison test. ∗ p < 0.05 versus control, ∗∗ p < 0.01 versus control, and ∗∗∗ p < 0.001 versus control.

