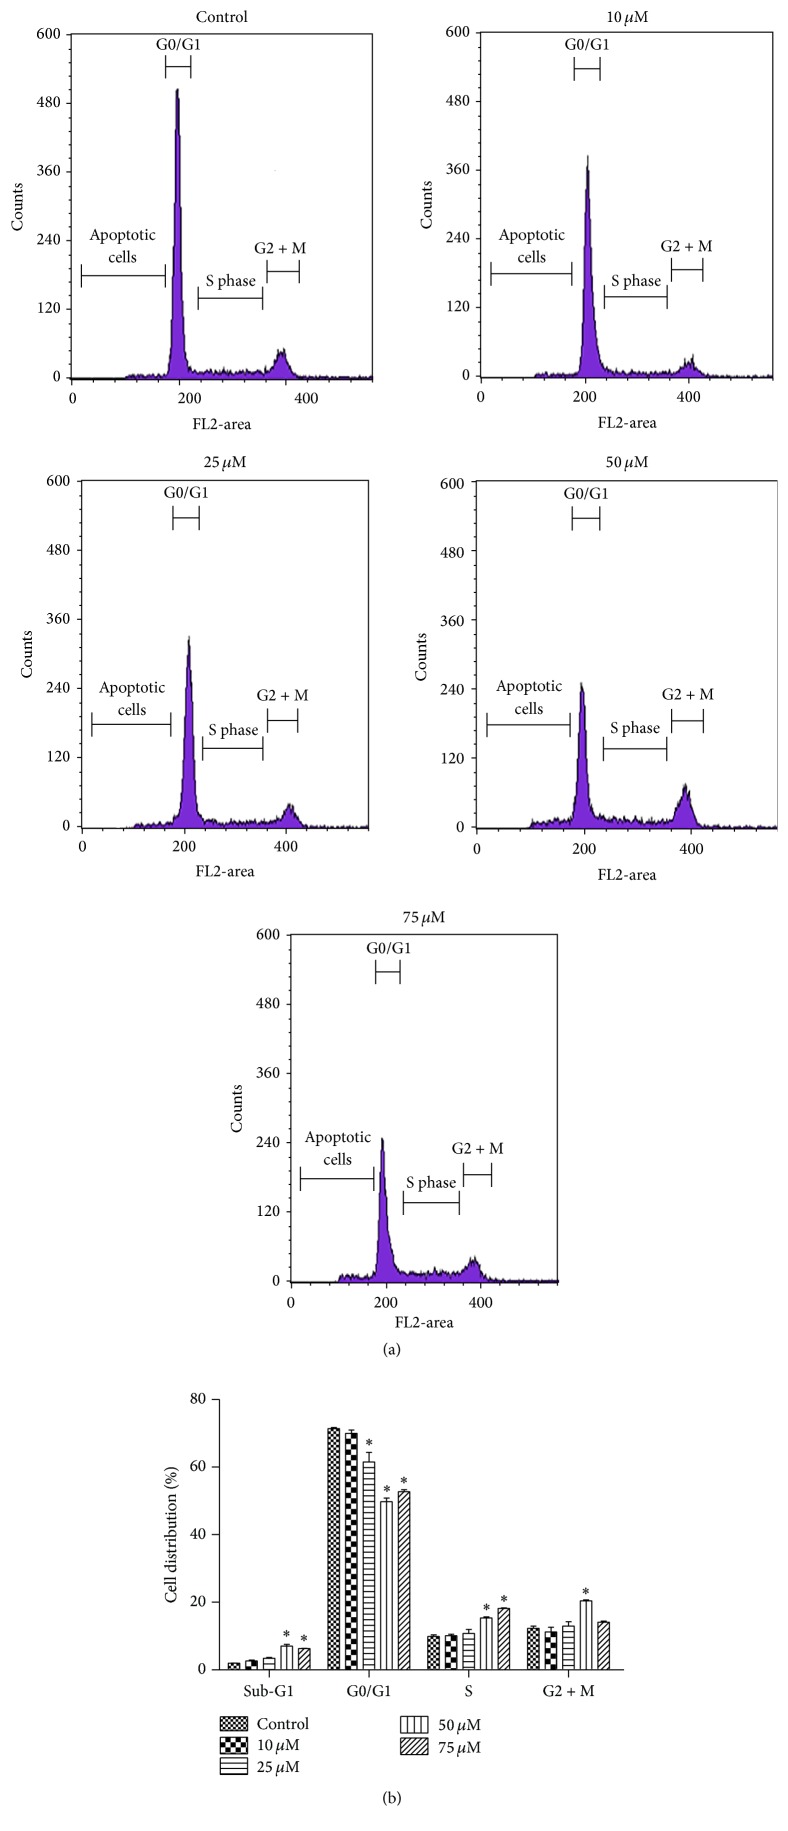
Figure 3.
Flow cytometric analysis of quercetin-induced cell cycle distribution in B-CPAP cells. Cells were treated with different concentrations of quercetin (10–75 μM) for 24 hours. Disruption of the cell cycle was analyzed by flow cytometry showing sub-G1 (apoptotic cells), G0/G1, S, and G2+M phases (a). Cell cycle bar graphs represent the percentage of cells within the different cell cycle phases (b). Differences between means and significance of the treatments were analyzed using ANOVA and Bonferroni posttest. Cell cycle bar graphs (b) represent mean ± SD, n = 3. ∗ p < 0.05 versus control.

