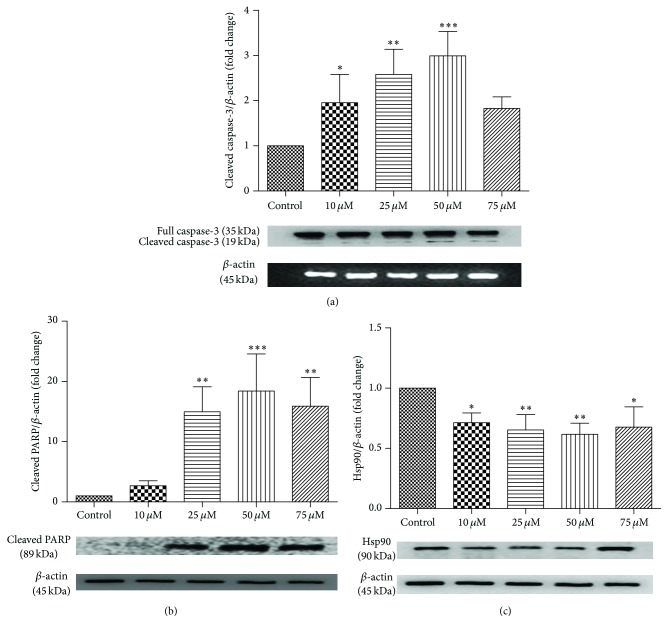
Figure 5.
Western blot analysis of caspase-3 cleavage (a), PARP cleavage (b), and Hsp90 (c) protein expression levels after quercetin treatment of B-CPAP cells. Band intensity was analyzed by densitometry. Fold change of protein expression levels was calculated after bands were normalized to β-Actin. Differences between means and significance of the treatments were analyzed using ANOVA and Bonferroni posttest. Bar graphs represent mean ± SD, n = 3. ∗ p < 0.05 versus control, ∗∗ p < 0.01 versus control, and ∗∗∗ p < 0.001 versus control.

