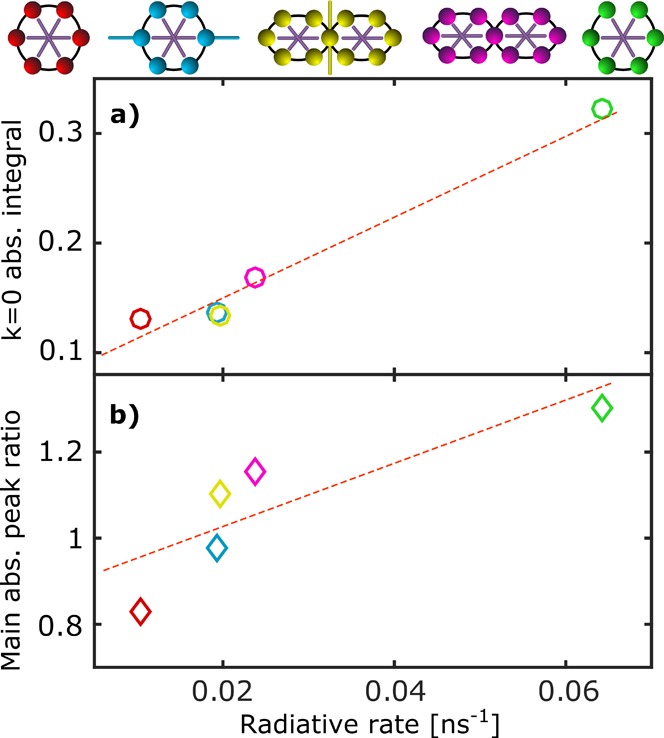
Figure 3.

Analysis of the extinction coefficient spectra for the nanoring complexes c-P6·T6 (red), c-P6x·T6 (blue), sEt-P11·(T6)2 (yellow), s-P11·(T6)2 (magenta), and l-P6·T6 (green) in relation to their radiative emission rates. (a) Spectrally integrated extinction coefficient of the emerging low-energy (k = 0) peak, determined by integration of the spectra shown in Figure 2 up to a full width at half-maximum below the first main peak and given in relation to the integral over the full spectrum of the Qx band. (b) Intensity ratio of the first two peaks in the main (k = ±1) peak series of the extinction coefficient spectrum. Each data point corresponds to a ring complex with the colors depicted matching that of the icons above the graphs representing the structure. Dashed lines are guides to the eye, highlighting the strong correlation between the parameters, but do not imply a particular functional dependence.
