
Figure 1.
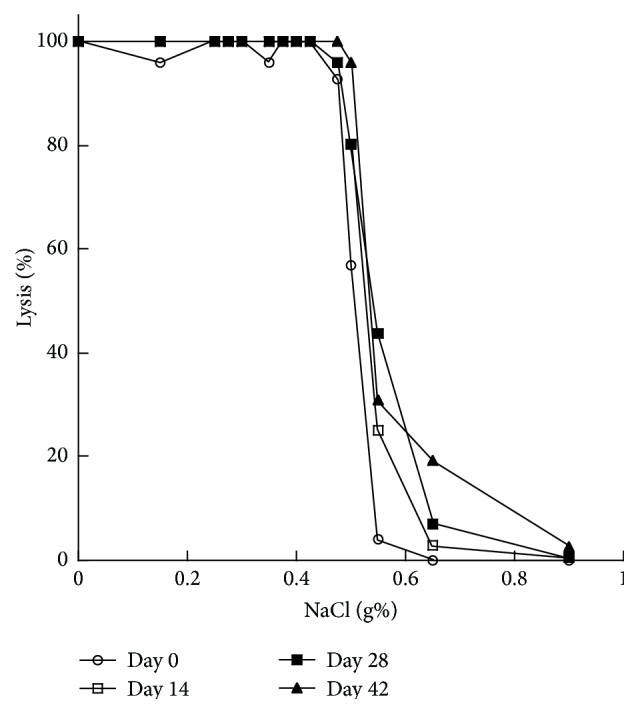
Erythrocytes osmotic fragility for leukoreduced packed RBC on standard method. The graph represents the measurements of osmotic fragility of stored pRBCs of different days. Day 0 normal range is indicated by the line with circle representing the lowest values of osmotic fragility, while the consecutive days show gradual shifting to the right, indicating an increase in osmotic fragility.