
Figure 3.
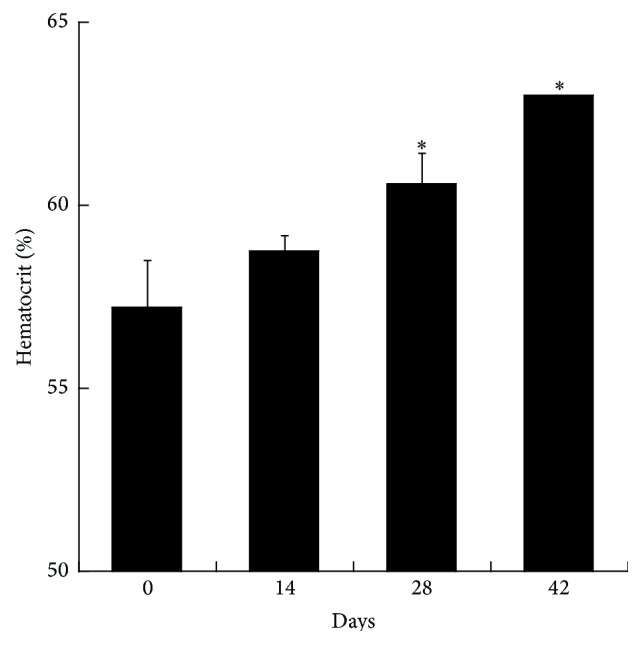
Hematocrit measured at four different time points of stored pRBCs. The bar chart demonstrates the increase in hematocrit measurements over the days of blood bag storage, including standard error bar (p value <0.05). The values shown are the mean ± SD of 3 independent experiments. ∗ p < 0.05, ANOVA compared to negative control cells.