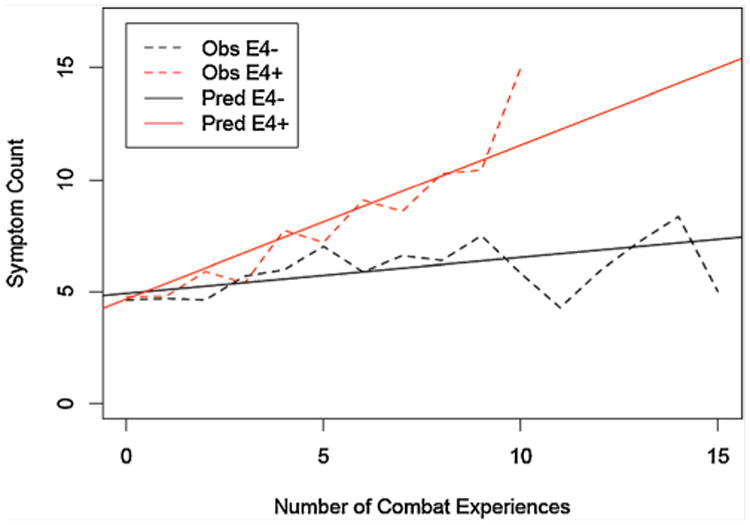
Fig. 1.

Moving-average smoothed graph of the number of combat-related PTSD symptoms among 172 participants who reported combat trauma by level of combat exposure. The mean number of PTSD symptoms is graphed for each apoE group (i.e., 1 or 2 vs. 0 €4 alleles; “€4+” vs. “€4−”). In addition to graphing the observed (“Obs”) mean, we also include a graph of the mean predicted (“Pred”) by the GEE-interaction model.
