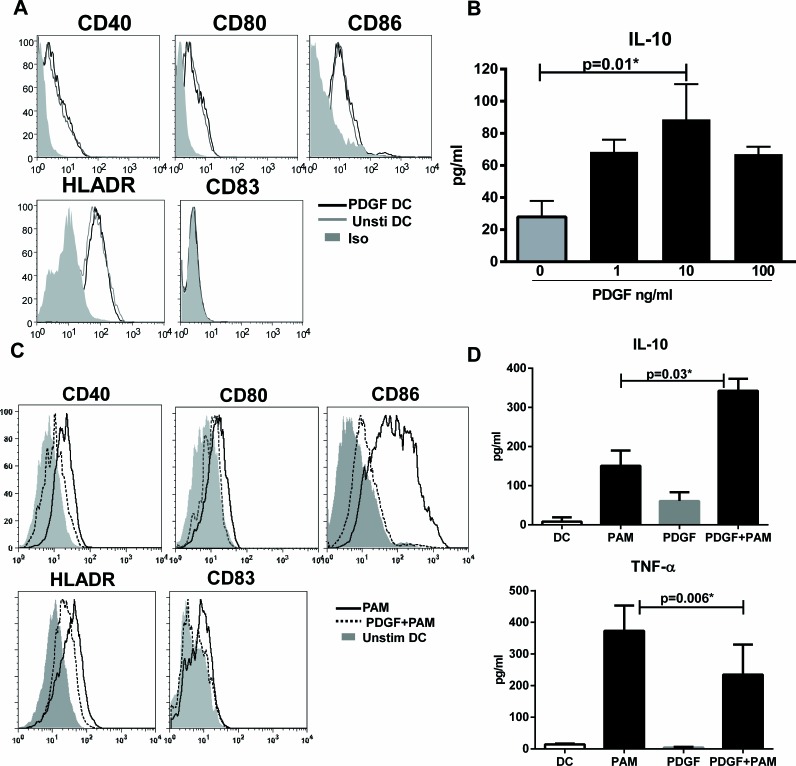
Figure 1. PDGF induces IL-10 in DCs.
DCs were cultured with PDGF AB at (1-100ng/ml) for 48h. A. Histograms depict the expression of costimulatory and antigen presenting molecules on PDGF stimulated DC (PDGF-DC) and unstimulated DC. Data is representative of 6 such experiments. B. Bar graph depicts the level of IL-10 secreted by PDGF-DC and unstimulated DC. DCs were exposed to PDGF for 24h and subsequently stimulated overnight with PAM. C. Histograms depict the expression of costimulatory and antigen presenting molecules on PAM stimulated DC (PAM), PDGF exposed +PAM-stimulated DCs (PDGF+PAM) and unstimulated DC. Data is representative of 6 such experiments. B. Bar graph depicts the level of IL-10 secreted by PDGF-DC and unstimulated DC. Data is mean +/− S.E. of 4 different subjects.

