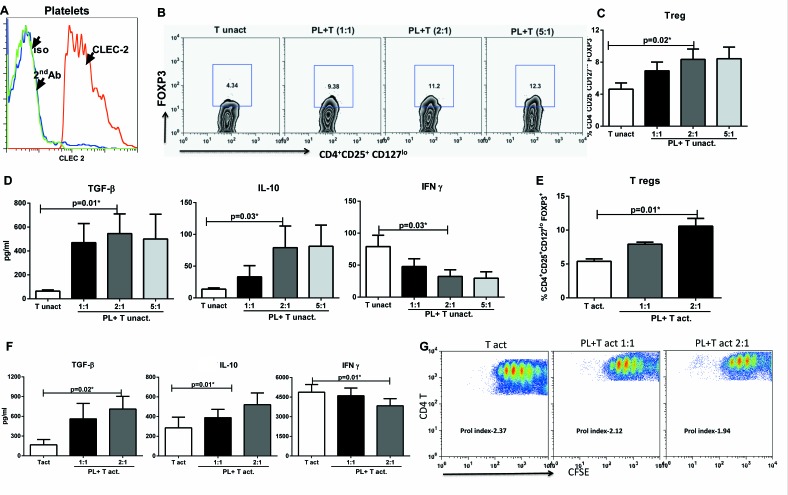
Figure 5. CLEC-2 expression on platelets induces T regulatory cells.
Platelets were cultured with T cells for 96h. A. Histogram depicts the expression of CLEC-2 on freshly isolated platelets. B. Zebra plot depicts the percentage of FoxP3+ cells in gated CD4+CD25+CD127loFoxP3+ cells in PL-CD4+T (unactivated) cell coculture. Figure is representative of 5 such experiments. C. Bar graph depicts the mean +/− S.E. of the same. D. Bar graphs depict the production of TGF-β, IL-10 and IFN-γ in the co-culture. Data is mean +/− S.E. of 5 different subjects. E. Bar graph depicts the percentage of FoxP3+ cells in gated CD4+CD25+CD127loFoxP3+ cells in PL-T (anti CD3+anti- CD28 activated) cell coculture. F. Bar graphs depict the production of TGF-β, IL-10 and IFN-γ in the co-culture. Data is mean +/− S.E. of 5 different subjects. G. Dot plots depict the T cell proliferation in PL- T (act) coculture as measured by CFSE dye dilution. Prol index is proliferation index. Figure is representative of 4 such experiments.

