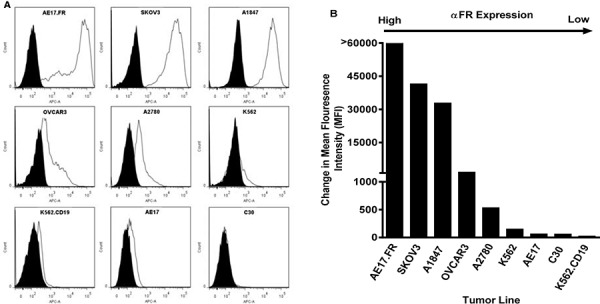
Figure 2. FRα surface expression of human ovarian cancer cell lines by flow cytometry.

A. FRα-specific mAb MOv18 was used to measure FRα expression of tumor cell lines by flow cytometry (open histogram), compared with IgG1 isotype controls (filled grey histogram). B. FRα expression as measured by the change in mean fluorescence intensity (MFI).
