
Figure 3. EGF-induced EGFR downregulation was prevented in H19 overexpressing cells.
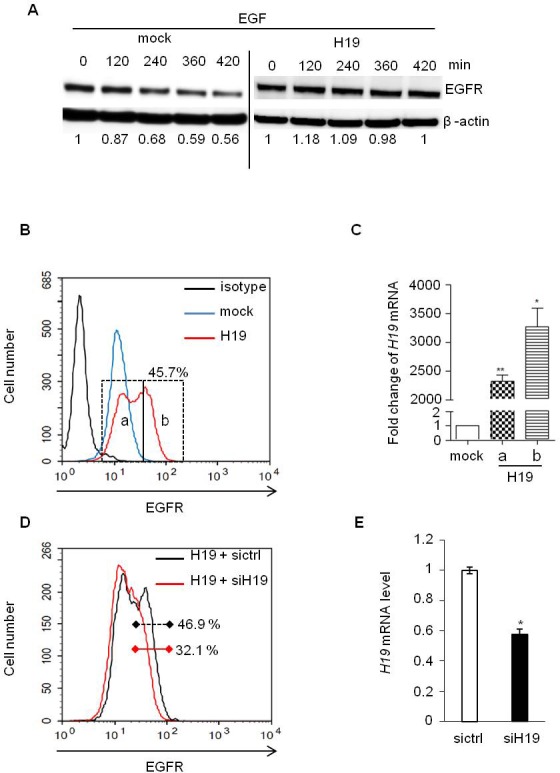
A. MDA-MB-231 control (mock) and H19-overexpressing cells (H19) were treated with EGF (50 ng/ml) and proteins were extracted at indicated times. Total EGFR levels were determined by western blot. The intensities of bands were quantified by densitometry (multigauge, Fujifilm), and the results obtained for EGFR expression during the time-course were compared to those obtained in control (indexed to 1) after normalization to actin expression. B. Flow cytometer analysis of membrane EGFR in MDA-MB-231 control cells (mock) and H19-overexpressing cells (H19). C. Subpopulations of H19 overexpressing cells with medium and high expression levels of cell surface EGFR (peaks a and b in Figure 3B) were sorted by FACS, and H19 expression was then quantified by qRT-PCR. Results are presented as relative levels in cells overexpressing H19 compared to control. *p < 0.05; **p < 0.005. D. H19-overexpressing MDA-MB-231 cells were transiently transfected with siRNA-H19, and membrane EGFR levels were then determined by flow cytometry analysis. E. Relative expression of H19 determined by qRT-PCR in breast cancer cells overexpressing H19 transfected with siRNA-H19 or siRNA-GFP as a control. *p < 0.05.