
Figure 5. H19/miR675 increased migration and proliferation of MDA-MB-231 breast cancer cells.
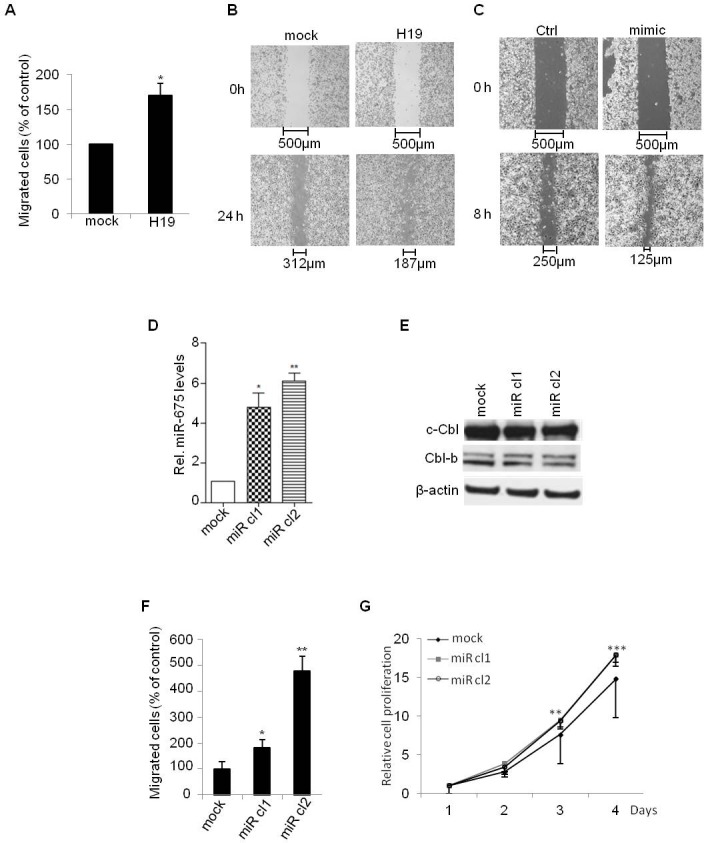
A. Control (mock) or H19-overexpressing (H19) cells were cultured in transwells for 24 h. Migrated cells were then colored with violet crystal and counted. Results are presented as the percentage of control. B. Wound healing assay performed on control (mock) and H19-overexpressing (H19) cells. C. Wound healing assay performed on control (ctrl) and transiently overexpressing miR-675 (mimic) cells. D. QRT-PCR analysis of expression of miR-675-5p in control (mock) and miR-675-overexpressing cells (miR cl1, miR cl2). Results are presented as relative levels compared to MDA-MB-231 control cells (indexed to 1). E. Western blot analysis of c-Cbl and Cbl-b levels in control and miR-675-overexpressing cells. F. Transwell migratory assay performed on control (mock) and miR-675-overexpressing cells after 6 h of culture. G. Cell proliferation determined by MTT test. Data represent mean of three independent experiments and error bar sem.*p < 0.05; **p < 0.005; ***p < 0.001.