
Figure 6. MiR-675 promoted tumor growth and metastasis.
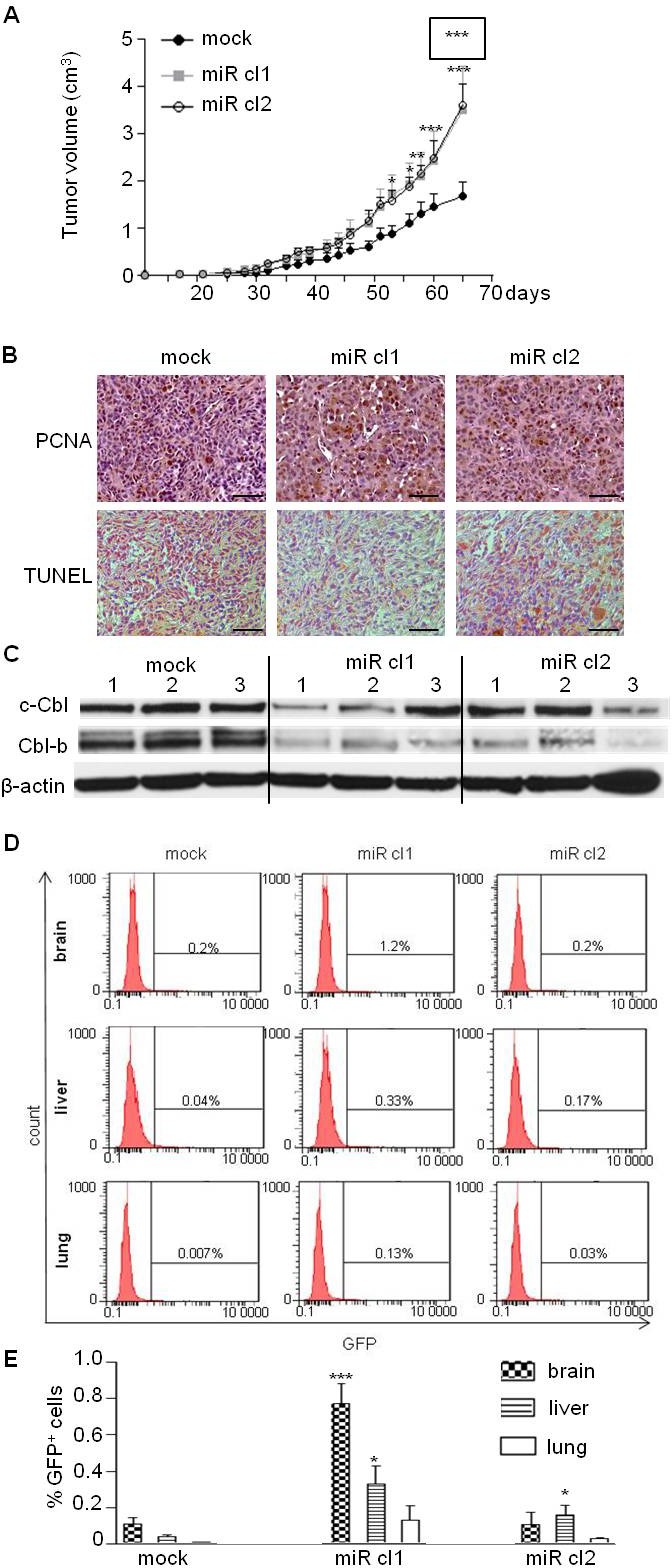
A. MDA-MB-231 control (mock) and overexpressing miR-675 (miR cl1, miR cl2) cells were subcutaneously injected into SCID mice (7 mice per group). Tumor growth curve represents the mean of tumor volumes in each group and error bar sem. MiR cl1 growth curve statistical analysis is surrounded. B. Detection of tumor cell proliferation (PCNA) and apoptosis (TUNEL) of paraffin-embedded sections of tumors 65 days after injections. Scale bar is 100μm. C. Western blot analysis of c-Cbl and Cbl-b levels in xenografted tumors. Tumors from three mice for each group were analyzed (mock, miR cl1, miR cl2). D. and E. Detection of GFP-positive cells by flow cytometry analysis in brain, liver and lung of mice xenografted with control or miR-675-overexpressing cells (mock, miR cl1, miR cl2). Histograms in E represent the mean of results from six xenografted mice *p < 0.05; **p < 0.005; ***p < 0.001.