
Figure 1. Heat map depicting unsupervised hierarchical clustering of metastatic and non-metastatic cell lines based on the differentially expressed miRNA measured by microarray and validation of miRNA alteration by qRT-PCR.
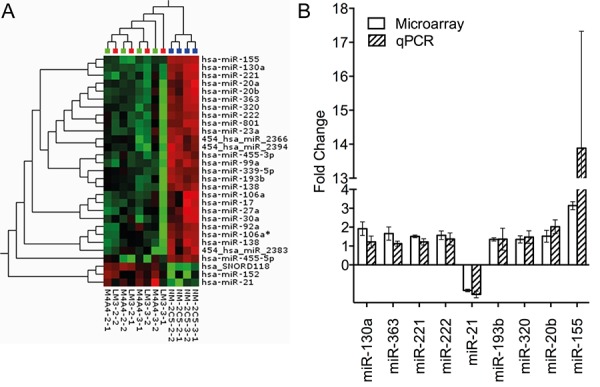
A. Top: Blue: Non-metastatic cell line NM-2C5, Green: Low metastatic cell line M-4A4, Red: Intermediate metastatic cell line LM3. Red squares in the hierarchical clustering represent higher expression and green squares lower expression of a given miRNA. B. Relative fold change of nine miRNAs in the non-metastatic and metastatic cell line groups measured by microarray and qRT-PCR. Values above one correspond to higher expression in the non-metastatic vs. metastatic cell line groups. Standard deviation is measured between the two biological replicates, each performed in triplicates.