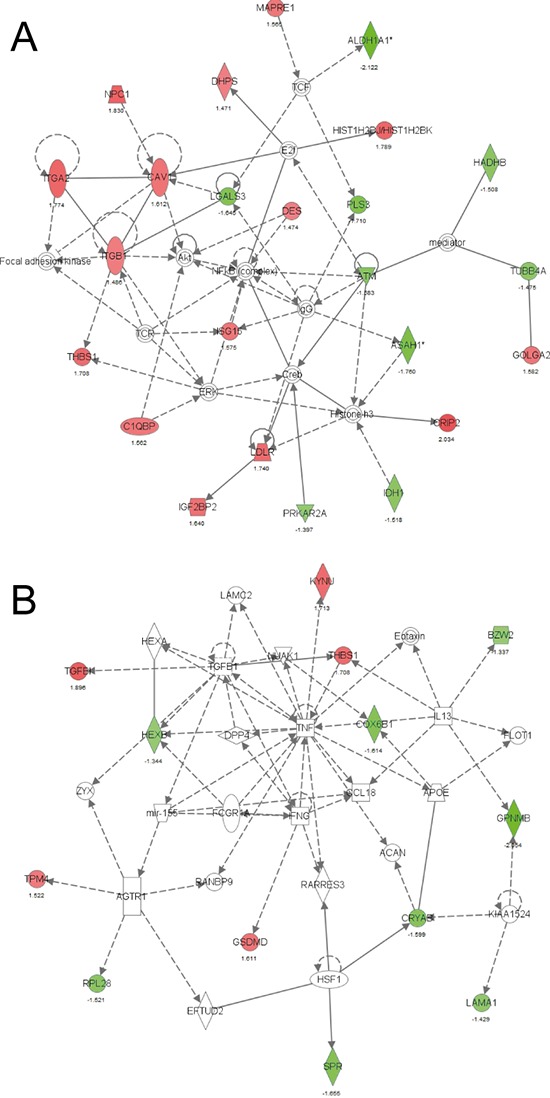
Figure 5. IPA network based on proteins exhibiting altered expression between CL16-miR-155- and CL16-Ctrl-derived xenograft tumors.

A. Network 1 with the highest score was related to Lipid Metabolism, Small Molecule Biochemistry, and Cellular Movement and B. Network 2 with the second highest score was related to Cell-To-Cell Signaling and Interaction, Cellular Growth and Proliferation, Cell Death and Survival. Red symbols indicate increased expression and green Red symbols indicate lower expression in CL16-miR-155- vs CL16-Ctrl-derived xenograft tumors.
