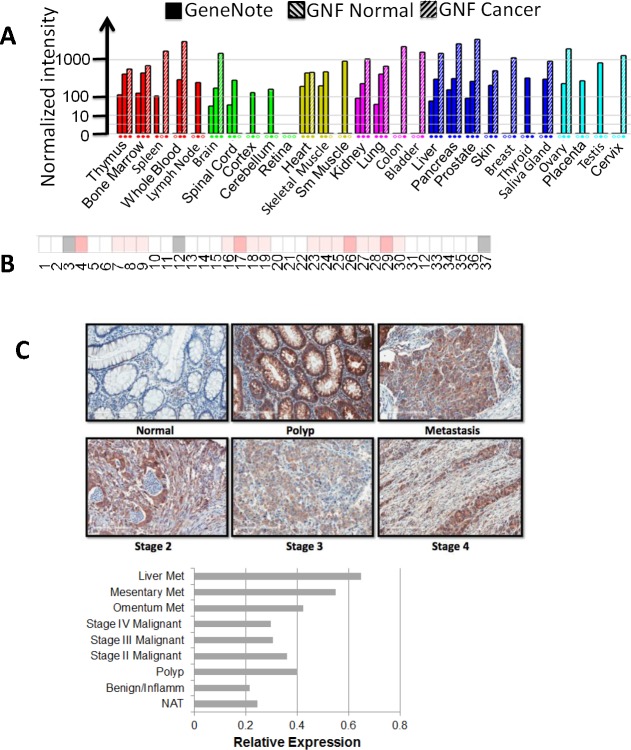
Figure 6. YBX1 is overexpressed in many types of cancer, especially in colon cancer.
A. GeneNote data, showing the expression level of YBX1 in different types of cancers; colon cancer shows very high expression level of YBX1. B. Oncomine data, showing the comparison of the expression of YBX1 in 37 colon cancer vs. normal datasets. The intensity of red color corresponds to the level of expression of YBX1, indicating that YBX1 is overexpressed in the specimens from many colon cancer patients. C.. Tissue microarray assay of YBX1, top panel, showing tissue sections stained with anti-YBX1 antibody, demonstrating elevated levels of YBX1 staining in polyps and different stages of colon cancer as compared to the normal tissue. Magnification fold: 20X. Bottom panel, showing relative expression of YBX1 across different stages of colon samples, polys and tumors showed relatively higher levels of YBX1 expression than that of normal adjacent tissue. Abbreviations: Met, metastasis; NAT, normal adjacent tissue.

