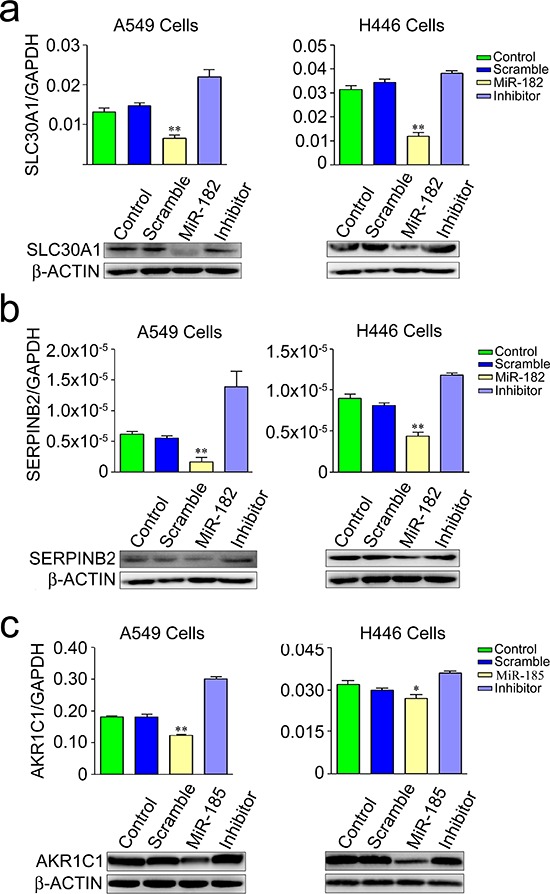
Figure 3. Suppression of endogenous mRNA (up panel) and protein (lower panel) of SLC30A1 a. SERPINB2 b. and AKR1C1 c. in A549 and H446 cells transfected with miR-182 mimic, miR-185 mimic or their inhibitor. Results of mRNA levels are mean ± SEM obtained from three experiments. *, P < 0.01 and **, P < 0.001 compared with control or inhibitor.

