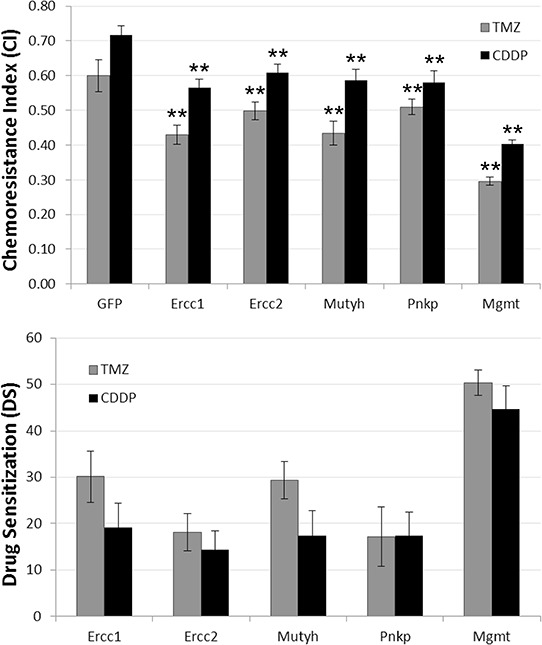
Figure 2. SiRNA-induced chemosensitization.

U373 cells were transfected with siRNA targeting GFP, Ercc-1, Ercc-2, Mutyh or Pnkp, and treated with CDDP (grey) or TMZ (black). A. The Chemoresistance Index (CI) corresponds to the proportion of a cell population that survived chemotherapy. It was computed as follows: cell number with chemotherapy / cell number (OD) in control condition. B. DS corresponds to the chemosensitivity induced by siRNA. Data represented the mean of 3 independent experiments. Statistically significant difference between effects induced by siRNA GFP and other siRNA were indicated by 2 asterisks (p < 0.01). Error bars represent the bootstrapped standard errors.
