
Figure 1. High COX-2 expression in breast cancer TAMs.
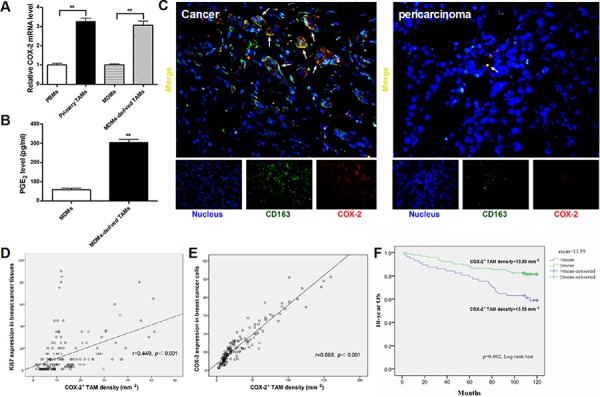
A. The relative COX-2 mRNA expression in different monocytes/macrophages. Mean ± SD, n = 9, **p < 0.01. B. PGE2 amount in supernatants of MDMs or MDMs-derived TAMs was measured by CIA assay. Mean ± SD, n = 9, **p < 0.01. C. The representative double immunofluorescence staining of CD163 (green) and COX-2 (red) in breast cancer tissues (Left) or pericarcinoma tissues (Right) (original magnification, × 400). D. Correlation of COX-2+ TAMs and Ki67 in breast cancer tissues (n = 160) was analyzed by Pearson's correlation analysis. E. Correlation of COX-2+ TAMs and COX-2 in breast cancer cells (n = 160) was analyzed by Pearson's correlation analysis. F. Kaplan-Meier 10-years OS curves for breast cancer patients according to COX-2+ TAMs density (n = 160).