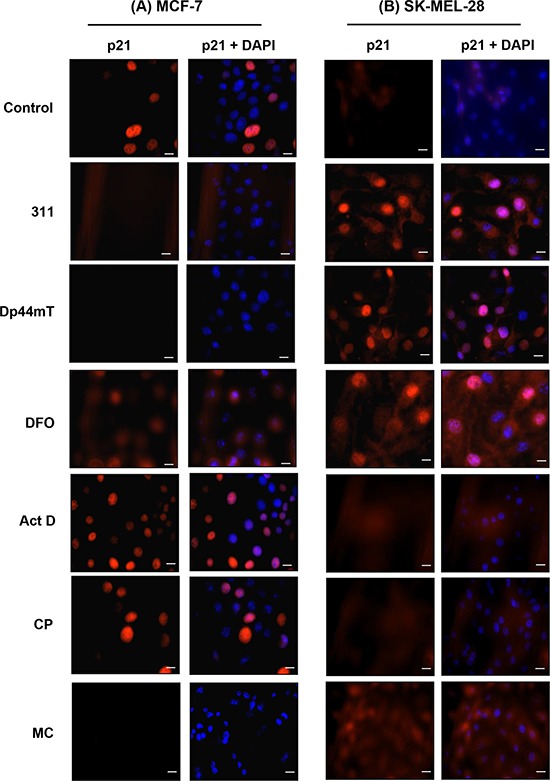
Figure 6. Immunofluorescence studies examining the cellular distribution of p21 observed in: A. MCF-7 cells, or B. SK-MEL-28 cells, in response to chelators or DNA-damaging agents.

Cells were incubated for 24 h/37°C with the chelators, 311 (25 μM), Dp44mT (2.5 μM), DFO (250 μM), or the DNA-damaging agents, Act D (5 nM), CP (20 μM), or MC (30 μM). Photographs were taken from cells incubated with primary p21 antibody and Alexa Fluor® 594 fluorescent dye conjugated secondary antibody and 4', 6-diamidino-2-phenylindole (DAPI). An electronic merge of both photos was used to demonstrate the nuclear localization of p21. The photographs are typical of three experiments. The scale bar in each image represents 20 μm.
