
Figure 1. Characterize of tumor exosomes and iDC.
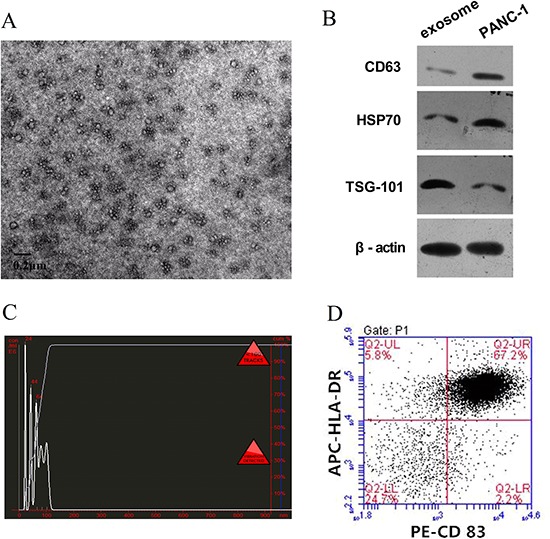
A. Exosomes observed by electron microscopy, which showed typical vesicular structures. B. Western blot analysis of PANC-1 derived exosomes. CD63, HSP70, and TSG101 could be detected in PANC-1 derived exosomes and PANC-1 cells. C. By NanoSight particle-tracking analysis, the size of exosomes distributed in the range from 30 nm to 110 nm. D. iDC was confirmed by flow cytometry. The double positive rate of CD83 and HLA-DR in the iDC attained up to 67.2%.