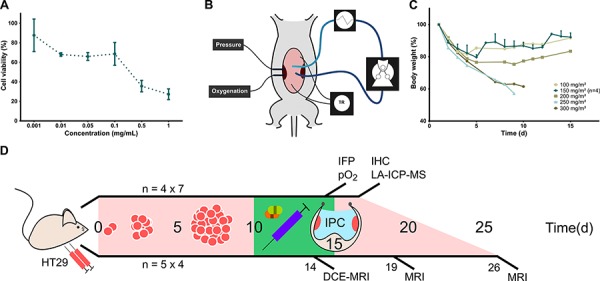
Figure 1. Oxaliplatin IPC model and experiment timeline.

A. Cell viability by MTT assay after application of different concentrations of Oxaliplatin with 1 h exposure (mean, standard deviation). B. Schematic representation of experimental set-up for Oxaliplatin IPC in mice. The perfusate flows through silicone tubing past a peristaltic roller pump and a heat exchanger. Temperature is recorded continuously and maintained around 37°C. Tumor IFP and oxygenation are monitored in vivo by intratumoral probes. C. Body weight decrease after Oxaliplatin IPC at increasing doses. IPC at 150 mg/m2 was repeated in three more mice to confirm the maximum tolerated dose. (Single values; 150 mg/m2: mean, standard deviation). D. Timeline of IPC experiments. The upper line shows the Oxaliplatin tumor penetration experiment with tumors resected immediately after IPC for LA-ICP-MS mapping. The lower line shows the tumor growth delay experiment in which mice underwent sequential MRI scans. N indicates the number of mice.
