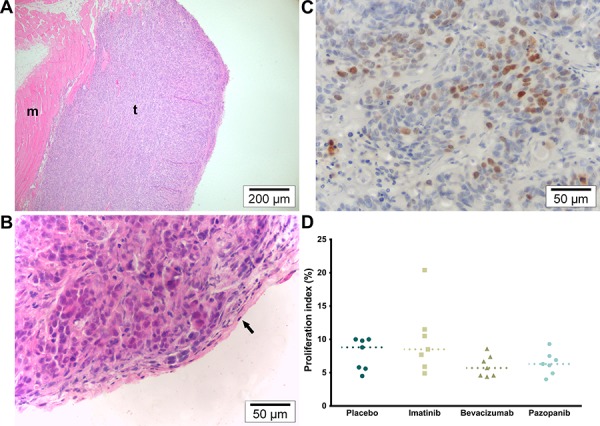
Figure 3. Microscopy overview and proliferation.

A. H&E (100×). Overview of representative tumor section. Tumors were sectioned according to their orientation so that each section showed both the peritoneal and the muscular border. M indicates muscle and t tumor tissue. B. H&E (400×). Detail of tumor in which the mesothelium can still be identified along the peritoneal border (arrow). C. KI-67 (400×). Average hot spot of tumor cell proliferation. D. Proliferation index (% KI67+ nuclei; p = 0.1482, single values, median).
