
Figure 4. Tumor vascularity.
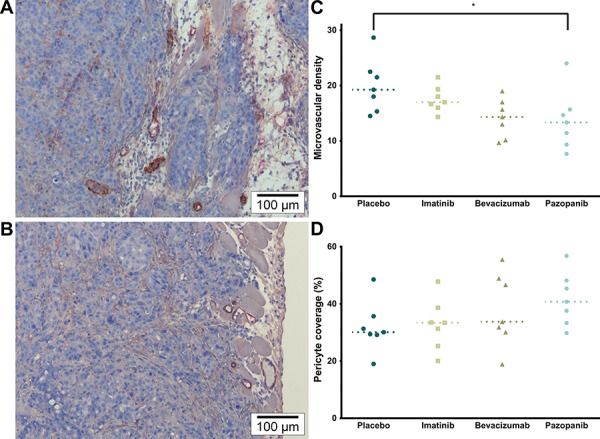
A. α-SMA (brown) & CD105 (red) (200×). Representative image of MVD and Pericyte coverage of the Placebo and Imatinib groups. B. α-SMA & CD105 (200×). Representative image of the Bevacizumab and Pazopanib groups, mainly showing reduced vascularity. C. Microvascular density (CD105+ vessels; p = 0.0323, single values, median). * Placebo vs. Pazopanib (p = 0.0424). D. Pericyte coverage (% α-SMA+ vessels; p = 0.2446, single values, median).