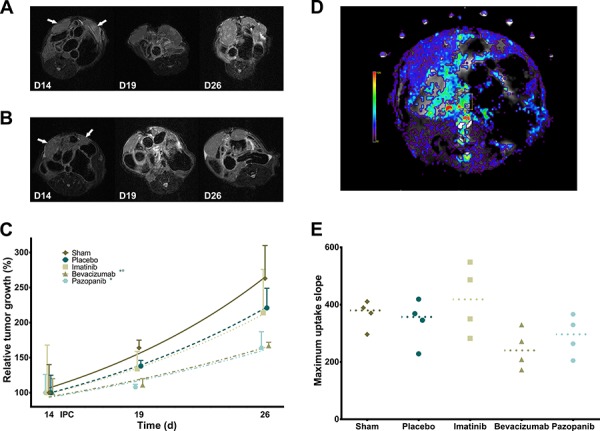
Figure 6. Tumor growth delay and vascularity.

A. Serial MRI images of mouse abdomen with bilateral tumor nodules (Placebo) as indicated by arrows. B. Serial MRI images (Bevacizumab). C. Relative tumor growth delay after IPC (exponential growth curves; p = 0.0006, mean, standard deviation). * Sham vs. Pazopanib (p < 0.05). *° Sham, Placebo vs. Bevacizumab (p < 0.05). D. Color overlay image of DCE-MRI analysis of maximum uptake slope. E. Tumor maximum uptake slope (p = 0.0890, single values, median).
