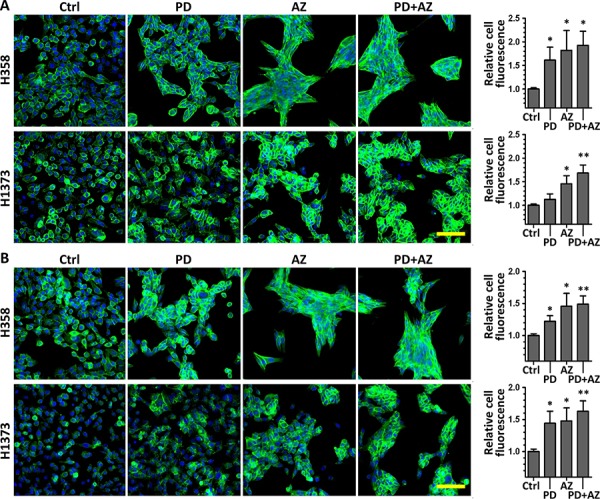
Figure 3. PD0325901, Saracatinib and the combination treatment increased epithelial markers E-cadherin and Plakoglobin expression and localization at the cell-cell contacts.

H358 and H1373 were treated with DMSO control (Ctrl), or with PD (1 μM), AZ (4 μM) or their combination for 48 h to induce MET. E-cadherin or Plakoglobin immunofluorescence imaging was performed and the cell fluorescence for each marker was quantified. A. representative images of E-cadherin stained cells (green) under various drug treated conditions. B. representative images of Plakoglobin stained cells (green) under various drug treated conditions. Cell nuclei were counterstained with Hoechst 33342 (blue). Scale bar: 100 μm. Graphs show the relative cell fluorescence intensity (mean ± SD) of each treated group compared to the control group, calculated from at least three independent experiments. *,P < 0.05; **,P < 0.01 compared with Ctrl group.
