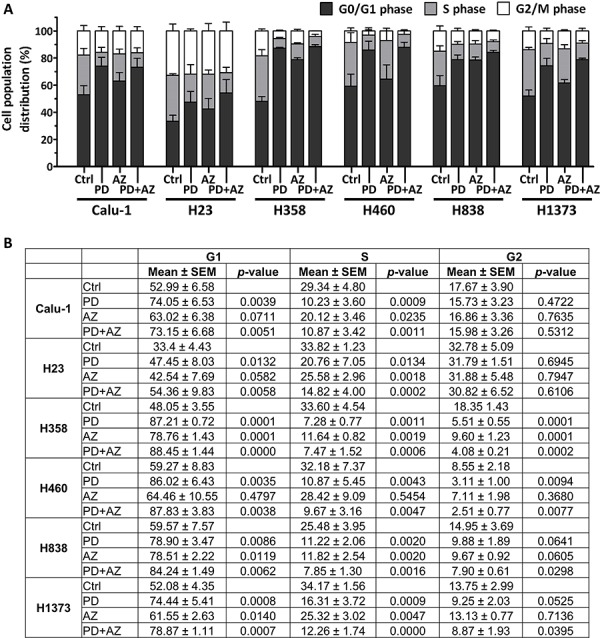
Figure 5. PD0325901 and Saracatinib and the combination treatment primarily exerted G1-phase cell cycle arrest in NSCLC lines.

Cell cycle analysis was performed on cell lines after treatment with DMSO control (Ctrl), or with PD, AZ or their combination for 48 h. Graph A. and table B. show the cell cycle distribution (mean ± SD) of each treatment group, calculated from at least three independent experiments. Statistical analyses were performed on treated groups as compared with Ctrl group.
