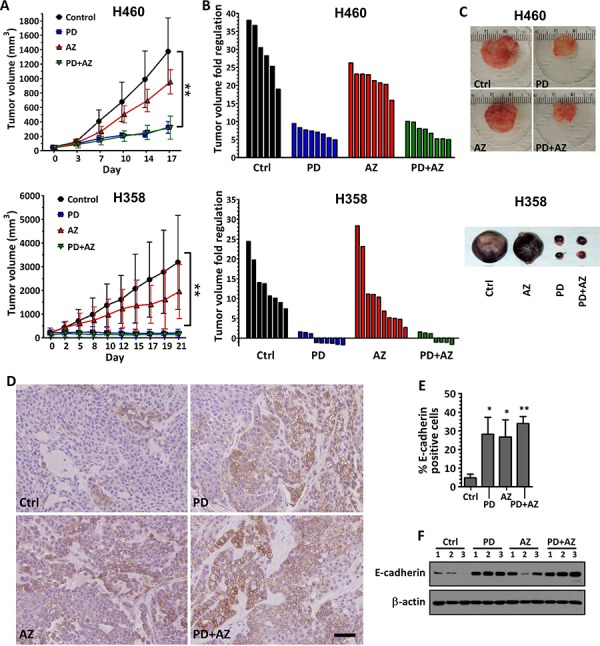
Figure 6. Inhibition of tumor growth and induction of E-cadherin expression in xenograft tumors by PD0325901 or Saracatinib treatment alone or in combination.

H460 and H358 cells were subcutaneously implanted into the flanks of nude mice. Treatment was started when average tumor volume reached 50 mm3 (for H460) or 200 mm3 (for H358) in size. Vehicle control only (Ctrl), PD (12.5 mg/kg), AZ (50 mg/kg) or their combination was administered daily. A. tumor volumes were measured biweekly and data were expressed as mean ± SD of 6 to 8 tumors per group. P < 0.01 compared with Ctrl group. B. waterfall plots showing the tumor volume fold regulation (relative to initial tumor volume) for the individual tumors in each treatment group after 17 days treatment. C. images of representative H460 and H358 tumors from each treatment group. D. E-cadherin expression levels were also assessed in the H460 tumors by IHC. Representative examples were shown. Scale bar: 50 μm. E. E-cadherin expression in the IHC images of H460 tumors was analyzed by quantifying the number of E-cadherin-positive cells (brown) compared to the total cells. Bar graph showing the mean percentage of E-cadherin-positive cells ± SD of 3 tumors per group. *,P < 0.05; **,P < 0.01 compared with Ctrl group. F. westernblot showing relative E-cadherin expression of whole tumor lysates for each treatment group of H460 tumor (n = 3 per group). β-actin shown as loading control.
