
Figure 1. p16 suppresses IL-6 expression and secretion.
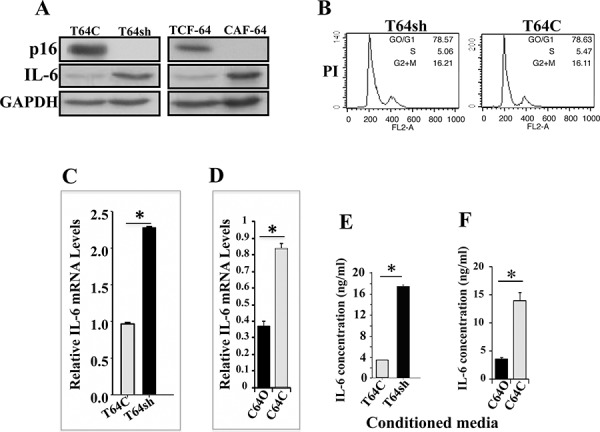
A. Whole cell lysates were prepared from the indicated cells and 60 μg of proteins were utilized for immunoblotting analysis using antibodies against the indicated proteins. B. DNA content of exponentially growing cells was determined by flow cytometry upon PI staining. C. and D. Total RNA was extracted from the indicated cells, and the amount of the IL-6 mRNA was assessed by qRT-PCR. Error bars represent means ± S.D. *p value < 0.000008. E. and F. Conditioned media from the indicated cells were collected after 24 h and the levels of the indicated proteins were determined by ELISA and were presented in the respective histograms. Error bars represent means ± S.D. *p value < 0.00025.