
Figure 4. miR-146b-5p represses breast stromal fibroblasts.
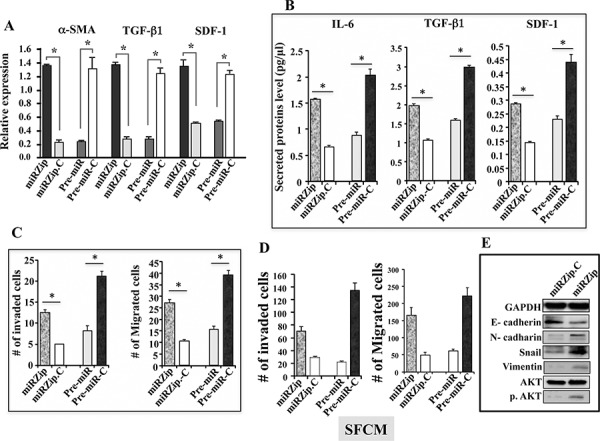
A. Total RNA was extracted from the indicated cells, and the mRNA levels of the indicated genes were assessed by qRT-PCR. Error bars represent means ± S.D. *p value < 0.012. B. Conditioned media from the indicated cells were collected after 24 h, and then the secreted levels of the indicated proteins were determined by ELISA and were presented in the respective histograms. Error bars represent means ± S.D. *p value < 0.02. C. Cells (4 × 10⁵) were cultured on the upper compartments of BioCoat matrigel chambers in the presence of SFM. After 24 h of incubation, cells were stained with Diff-Quick stain then counted, and the average numbers of invasive and migrated cells are depicted in the histograms, error bars represent means ± S.D. *p value < 0.025. D. SFCM were collected after 24 h of incubation from the indicated cells, and were added independently into the lower compartments of 24-well BD BioCoat plates. 105 MDA-MB-231 cells were seeded onto the upper compartments of the migration and invasion plates and incubated for 24 h in the presence of SFM. The number of migrated/invaded cells was represented in histograms. Error bars represent means ± S.D. E. Whole cell lysates were prepared from MDA-MB-231 cells that were treated for 24 h with SFM (used as control) or SFCM collected from the indicated cells. Immunoblotting analysis was performed using antibodies against the indicated proteins.