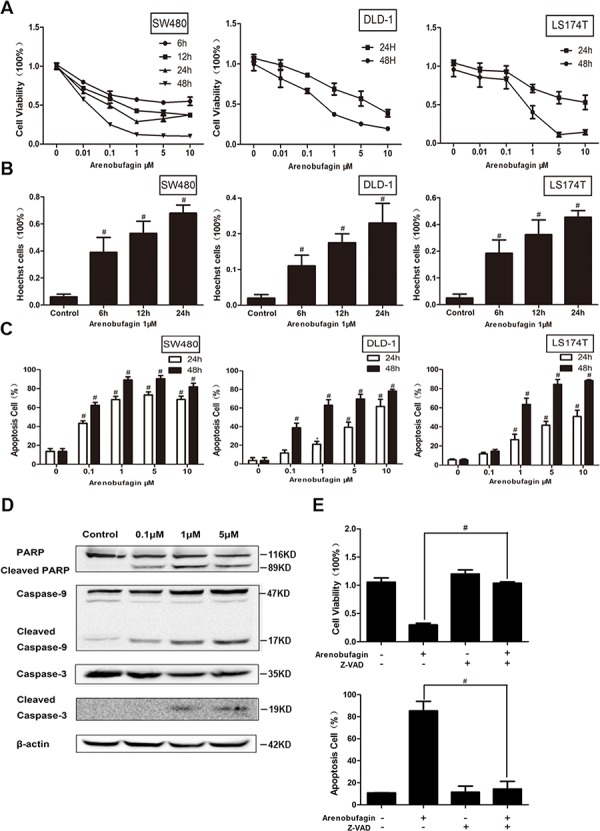
Figure 1. Arenobufagin induces tumor cell apoptosis.

A. The percentage of viable cells measured by the MTT assay at 24 and 48 h relative to no-drug controls and arenobufagin concentrations were plotted as log-dose response curve (n = 6 per group). B. Cells were stained with Hoechst33342 (5 μg/ml) and subjected to analysis of apoptosis population (n = 3). C. PE-annexin V/7-amino-actinomycin D exposed on the cell surface was measured by flow cytometric analysis (n = 3). Data derived from three separate experiments are presented as the means ± S.E.M. D. Total cell lysates were prepared for western blot analysis of the apoptosis regulatory proteins (n = 3). E. Cells were treated with the combination of arenobufagin and Z-VAD-fmk (20 μM). Cell viability was assayed or annexin V-positive cells were quantitatively analyzed (n = 6 per group). *P < 0.05, #P < 0.01, one-way ANOVA, post hoc comparisons, Tukey's test. Columns, means; error bars, SEs. See also Supplementary Figure S1.
