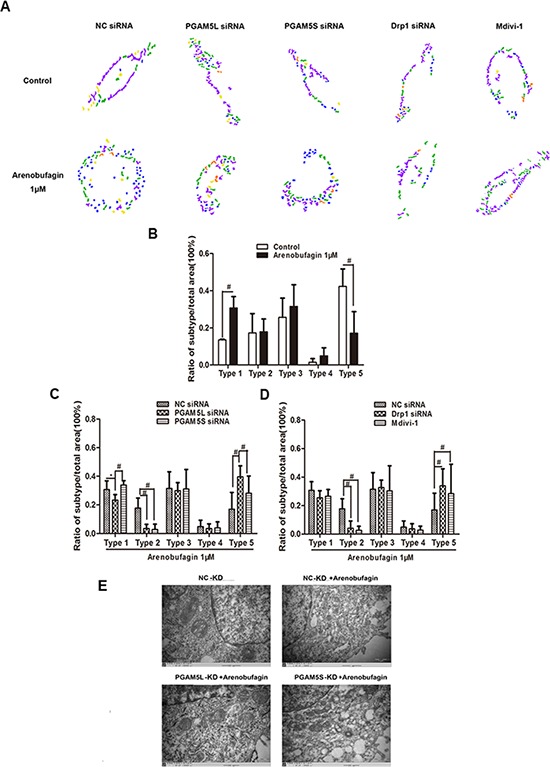
Figure 5. PGAM5 and Drp1 regulates mitochondrial morphology in the induction of apoptosis.

A. Micro-P analysis of mitochondrial morphology in HCT116 WT cells treated with arenobufagin in the absence or presence of PGAM5L siRNA, PGAM5S siRNA, Drp1 siRNA (100 nM) or Mdivi-1 (50 μM). The Micro-P algorithm classified mitochondria into small fragmented mitochondrion (type 1, blue), large fragmented mitochondrion (type 2, yellow), straight tubular mitochondrion (type 3, green), curved tubular mitochondrion (type 4, orange), and horse-shoe, donut, or network tubular mitochondrion (type 5, purple). B. A representative presentation of Micro-P analysis is shown. C–D. Bar graphs at the bottom show the percentages of type 1 to type 5 mitochondria, and are expressed as the means ± S.D. *P < 0.05, #P < 0.01, n = 5, one-way ANOVA, post hoc comparisons, Tukey's test. Columns, means; error bars, SEs. E. Mitochondrial morphological changes of arenobufagin-treated cells as observed by TEM. 15000× for all, scale bar = 2 μm.
