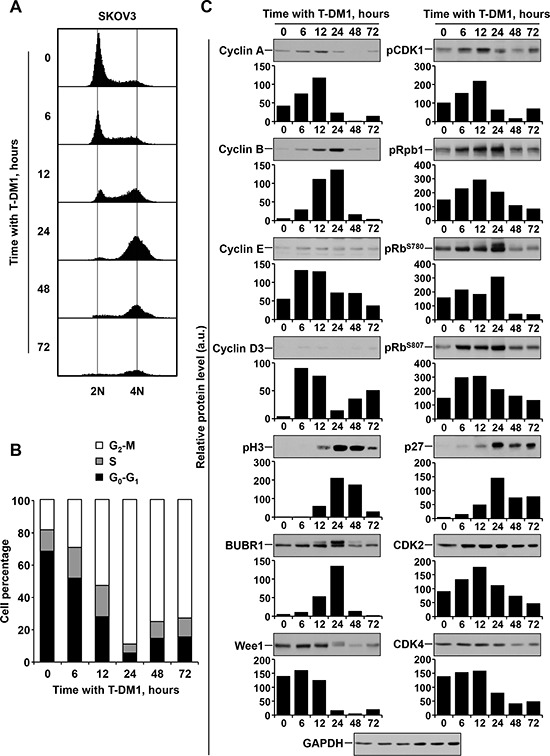
Figure 4. Effect of T-DM1 on the cell cycle of SKOV3 cells.

Cells were treated with 50 nM T-DM1 for the indicated times and cell-cycle phases were quantitatively analyzed by PI staining and FACS. A. Cell cycle profile. B. Histograms representing the percentage of cells in the different phases of the cell cycle. C. SKOV3 cells were treated with T-DM1 (50 nM) and lysed at the indicated times. The expression of different proteins was determined by Western blot. GAPDH was used as loading controls. Bar graph quantitative analysis of the intensity of the bands with respect to GAPDH is shown.
