
Figure 2. Cisplatin in vivo response and platinum intracellular levels.
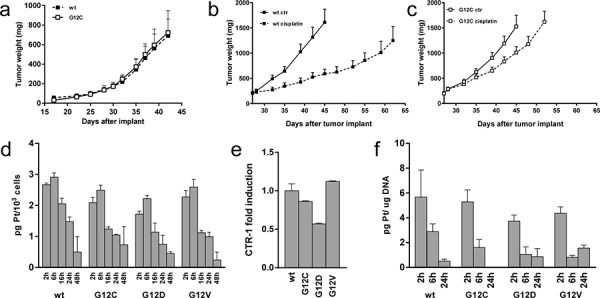
a. Tumor growth after injection of KRAS(G12C) or KRAS(wt) cells in opposite sides of nude mice (N = 5). Statistical analysis was performed using two-way ANOVA test and Bonferroni post-test for multiple comparisons and no differences were detected. b–c. Tumor growth inhibition activity on KRAS(wt) (b) or KRAS(G12C) (c) clones injected mice (N = 8) treated with cisplatin intravenously at 5 mg/Kg 3 times every 7 days or vehicle. Means and SEM are shown. Statistical analysis results are reported in Supplementary Table S1. d. Assessment of intracellular platinum concentration. The average of 3 different biological replicates and SD are shown. Statistical analysis results are reported in Supplementary Table S1. e. Relative expression levels of the CTR-1 measured by real time PCR at basal level. KRAS(wt) clone was set to 1. The average of 3 different technical replicates and SD are shown. f. Assessment of platinum adducts bound to DNA after cisplatin treatment for 2 h at 10 uM. The average of 3 different biological replicates and SD are shown. Statistical analysis results are reported in Supplementary Table S1.