
Figure 4. Focal accumulation of DSB repair proteins after cisplatin treatment.
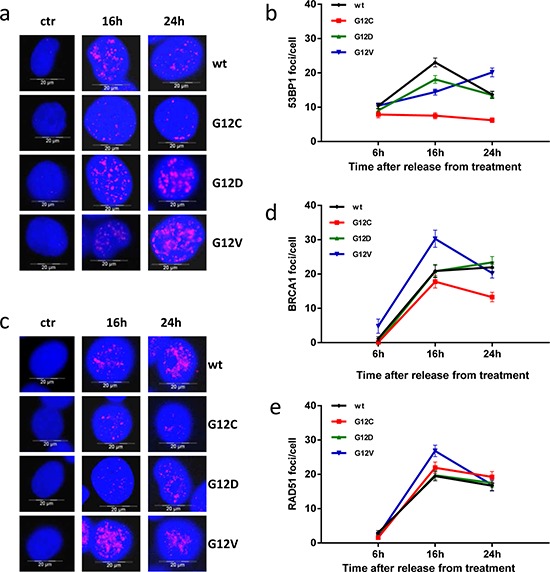
a and c. Representative images for 53BP1 (a) and BRCA1 (c) foci quantification after treatment with cisplatin were obtained as for γH2AX in Figure 3d. b, d and e. 53BP1 (b), BRCA1 (d) and RAD51 (e) foci were quantified and graphically presented as for γH2AX in Figure 3e. Mean values and SEM are shown. Statistical analysis results are reported in Supplementary Table S1.