
Figure 5. DSB repair activities and analysis of alternative DNA repair pathways.
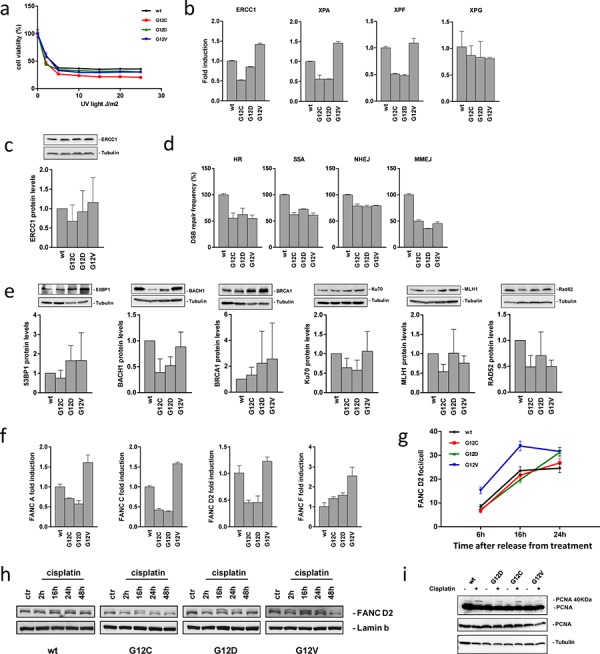
a. Response of cells to treatment with UV light detected by MTS assay. The data of the survival curves were plotted as percentages of untreated controls 72 h after irradiation. The average of 3 different experiments and SD are shown. Statistical analysis results are reported in Supplementary Table S1. b. Relative mRNA expression levels of genes involved in NER measured by real time PCR at basal level. Values for the KRAS(wt) clone were set to 1. The average of 3 different technical replicates and SD are shown. c. Expression of endogenous ERCC1 protein in the clones and its graphical presentation. Band intensities of Tubulin were used for individual normalization and values for the KRAS(wt) clone were set to 1. Quantification from 4 independent Western blots (means, SD) are shown. Statistical analysis was performed using one-way ANOVA test and Bonferroni post-test for multiple comparisons and no differences were detected. d. DSB repair frequencies. Values for cells from the KRAS(wt) expressing clone were set to 100% (absolute values for HR: 16%; SSA: 31%; NHEJ: 44%; MMEJ: 5%) and relative mean frequencies and SEM from 6 measurements are shown. Statistical analysis results are reported in Supplementary Table S1. e. Endogenous 53BP1, BACH1, BRCA1, KU70, MLH1 and RAD52 protein levels in the clones and their quantification. Band intensities of the Tubulin were used for individual normalization. Quantification from 2–6 independent Western blots (means, SD) are shown. Statistical analysis results are reported in Supplementary Table S1. f. Relative mRNA expression levels of genes involved in the FA repair pathway measured by real time PCR in the clones at basal level. Values for the KRAS(wt) clone were set to 1. The average of 3 different technical replicates and SD are shown. g. FANCD2 immunolabeled foci from 2 slides from independent experiments were scored by automated quantification in 50 nuclei per slide and graphically represented. Mean values and SEM are shown. Statistical analysis results are reported in Supplementary Table S1. h. Representative Western blot analysis displaying levels of ubiquitylated, i.e. activated FANCD2 protein (upper band) and unmodified FANCD2 (lower band) in the clones treated or not with cisplatin. Lamin B was used as loading control. Two independent experiments have been performed. i. Representative Western blot analysis showing levels of mono-ubiquitylated, i.e. activated PCNA protein (long exposure, upper band) and the unmodified form of the protein (long exposure, lower band, and short exposure) in the clones treated or not with cisplatin. Tubulin was used as loading control.