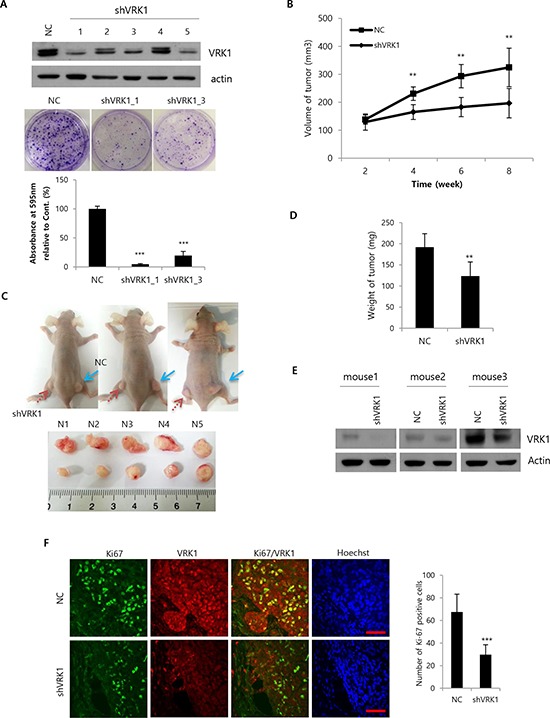
Figure 2. Growth of HCC tumors after VRK1 depletion in vivo.

A. SK-Hep1 cells were transduced with a lentiviral vector encoding VRK1- or negative control (NC)-shRNA sequences. Five lentiviral particles (Clones 1–5) targeted to different sequences in the VRK1 gene were used and the efficiencies of the VRK1 depletion were compared by Western blotting 1 week after transduction (upper panel). Colony formation assays were performed using stably transduced SK-Hep1 cells (middle panel). Colonies were quantified by measuring the absorbance of extracted crystal violet at 595 nm (lower panel). B. 5 × 10⁶ cells were injected subcutaneously. Tumor sizes were measured in 10 mice every 2 weeks after injection, and are shown as means ± SEM (upper panel). C. Photographs of mice were taken after sacrifice. NC (blue arrow) and shVRK1 (red arrow) indicate the flanks injected with SK-Hep1 cells transduced with NC shRNA or VRK1 shRNA (upper panel). Tumors were collected from the sacrificed mice and their sizes compared (lower panel). D. Tumor weights were measured after sacrifice of mice, and are shown as means ± SEM. E. Levels of VRK1 in injected tumors were analyzed by Western blotting after sacrifice. F. Levels of Ki-67 and VRK1 were assessed immunohistochemically using a confocal microscope, and Ki-67-positive cells were counted in randomly obtained images. Scale bar indicates 50 μm. (***p < 0.001; **p < 0.01)
