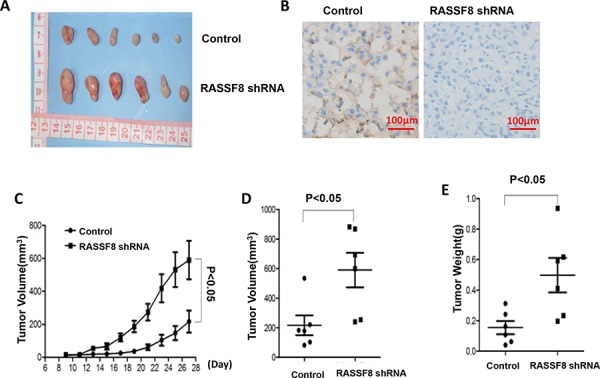
Figure 7. Growth of tumor xenografts in nude mice: comparison of M24 control and M24 RASSF8 shRNA.

A. Tumor xenografts. B. Representative photograph of RASSF8 IHC of xenograft tumor. C. Growth curve of xenograft tumors. D. Volume of xenograft tumor. E. Final weight of xenograft tumors. Xenograft tumors grew faster when RASSF8 expression was knocked down by RASSF8 shRNA.
