
Figure 2. Subgroup survival analysis according to treatment response.
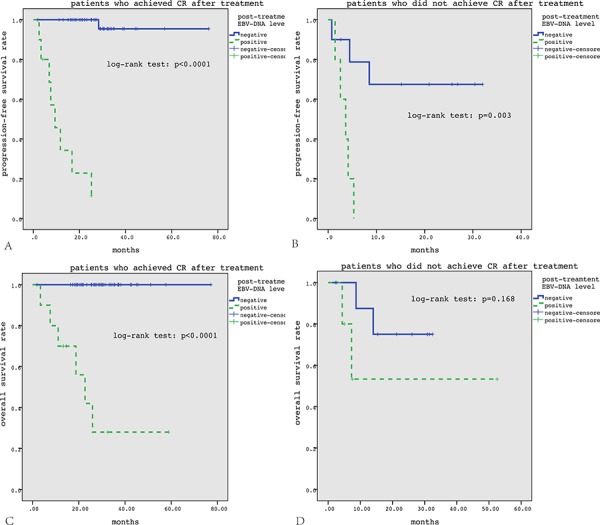
In patients who got CR after treatment, positive post-treatment EBV-DNA level correlated with significantly inferior PFS and OS A, C. In patients who did not get CR after treatment, positive post-treatment EBV-DNA level correlated with significantly inferior PFS but not OS B, D.