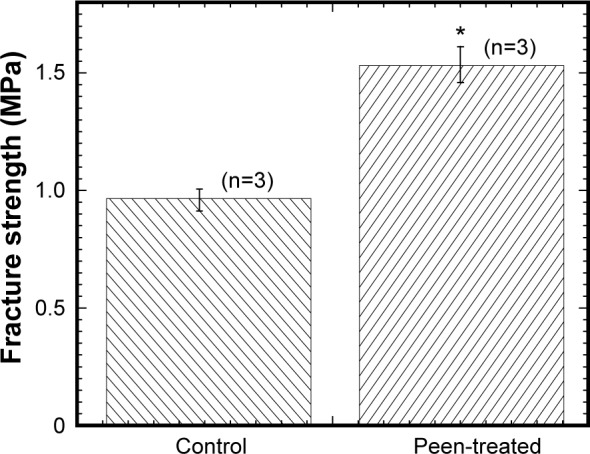
Figure 12.

Bar diagram of the variation of fracture strength of control samples (Ti) with peen-treated samples.
Notes: Data presented as mean ± standard error of mean; n=3 for control and laser peen-treated samples. *P<0.05 (compared to control).
Abbreviation: Ti, titanium.
