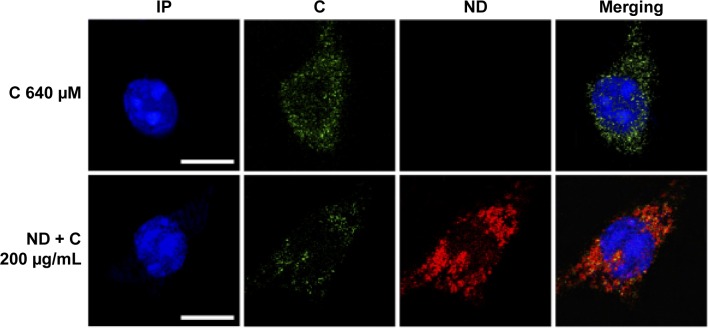
Figure 3.
Confocal microscopy.
Notes: Microscopic observations of C (640 μM) and ND + C (200 μg/mL) treated B16F10 cells for 72 hours. Nuclear region, shown in blue and stained with propidium iodide (IP), citropten signal, in green (C), and nanodiamond reflection, in red (ND), are shown. The merging images of all the signals are also produced. The white bars indicate 15 μm.
Abbreviations: C, citropten; ND, nanodiamond.

