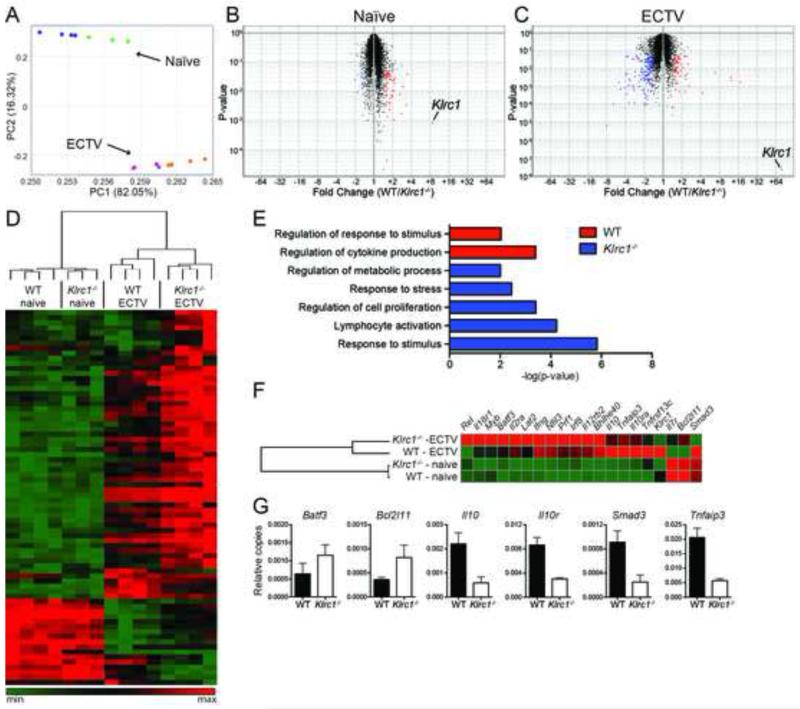
Figure 4. Differential expression of genes associated with lymphocyte activation in Klrc1−/− ECTV-specific CD8+ T cells.
CD3+CD8+B8R-H2-Kb+ T cells were sorted from WT and Klrc1−/− mice infected with ECTV and total RNA was isolated. As a control, RNA was isolated from total CD3+CD8+ T cells of naïve WT and Klrc1−/− mice. Transcriptomes of all RNA samples were assessed by microarray analysis. (A) Principal component analysis of total naïve and ECTV-specific CD8+ T cells. Naïve WT (blue dots), naïve Klrc1−/− (green dots), WT infected (purple dots), and Klrc1−/− infected (orange dots) samples are shown. (B, C) Volcano plots of naïve WT versus naïve Klrc1−/− CD8+ T cells (B) or ECTV-specific WT versus ECTV-specific Klrc1−/− CD8+ T cells (C). Transcripts differentially expressed in Klrc1−/− cells (blue dots) versus WT cells (red dots) are labeled. Klrc1 is also indicated in both plots. (D) Heatmap of all genes differentially expressed between WT and Klrc1−/− CD8+ T cells. The scale ranges from minimum (green boxes) to medium (black boxes) to maximum (red boxes) relative expression. (E) Gene ontology pathway analysis of ECTV-specific CD8+ T cells. Red bars indicate pathways overrepresented in WT cells and blue bars indicate pathways overrepresented in Klrc1−/− cells. (F) Heatmap of genes representative of the differentially expressed pathways depicted in (E). Coloration is equivalent to that used in (D). (G) Quantitative RT-PCR amplification of relevant genes to validate microarray analysis data. All transcripts are shown relative to Gapdh copy number.

