
Figure 3.
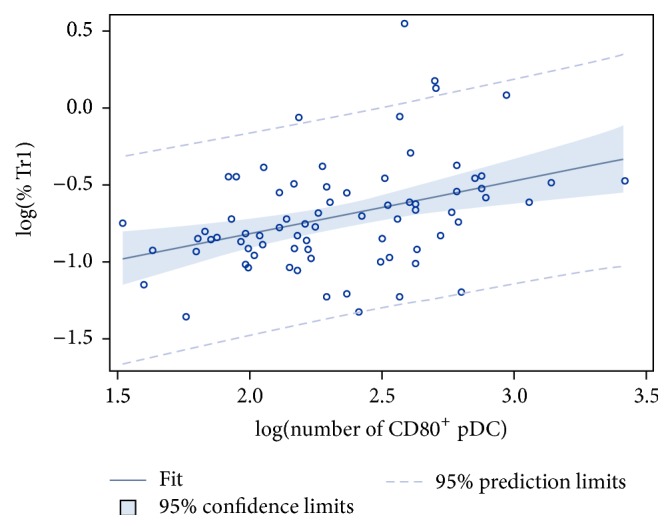
Positive correlation at log-log scale between the proportion of Tr1 and the number of CD80+ pDC. A positive correlation at log-log scale was found between the proportion of Tr1 cells and the number of CD80+ pDC (P = 0.001; ρ = 0.383). Both variables were log-transformed to obtain a normal distribution. pDC, plasmacytoid dendritic cells; Tr1, type 1 regulatory T cell; log, logarithmic transformation; ρ, Pearson's correlation coefficient.