
Figure 3.
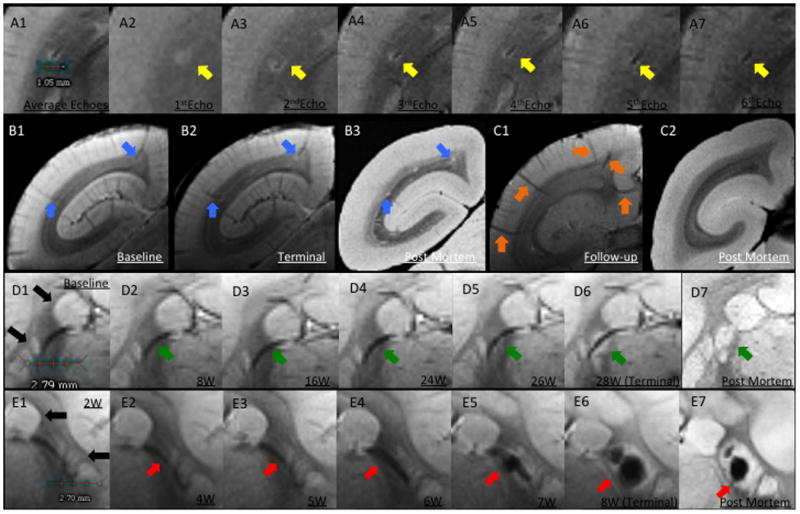
Perivenular development of lesions. A. In vivo T2*. A1, Average of all 6 echoes: A2, TE (echo time)=3.5ms; A3, TE=10.5ms; A4, TE=17.5ms; A5, TE=24.5ms; A6, TE=31.5ms; A7, TE=38.5ms. In A1, the dark line represents the lesion's central vessel, which is surrounded by the bright lesion. A2-A7, Progressive darkening of the central vessel relative to the surrounding lesion, reflecting increasing magnetic susceptibility. B. Left brain hemisphere of WMH1. B1, Arrows point to two pre-existing superficial veins visible at baseline, before EAE induction; B2, Lesions surround these two veins on the final scan; B3, Removal of intravascular blood at time of perfusion allows clear visualization of lesions, but not associated veins, on postmortem MRI. C, Left hemisphere of a control animal. C1, Arrows point to five representative superficial veins; C2, Postmortem MRI with nonvisualized superficial veins. D. Lesion development around a deep white matter vein in WMH2. D1, Baseline (pre-immunization) T2* average. Note that basal ganglia structures have similar signal intensity to lesions (black arrows). D2-D6, Consecutive averaged T2*-weighted images at different time points (W=weeks after immunization). Arrows point to a deep vein that was detected at baseline and was unchanged until 24 weeks, when the earliest sign of the developing lesion could be detected. D7, Postmortem T2*, showing the apparent absence of a central vein due to removal of intravascular blood. E. Lesion development surrounding a deep white matter vein in rhMOG1, with eventual hemorrhage. E1-E6, Consecutive averaged T2*-weighted images at different time points. E5-E6, Arrows point to a lesion with central hemorrhage. E7, Postmortem MRI shows persistent central low signal related to the intralesional hemorrhage. Similar to D, the vein itself is not visualized on the postmortem scan due to removal of intravascular blood.