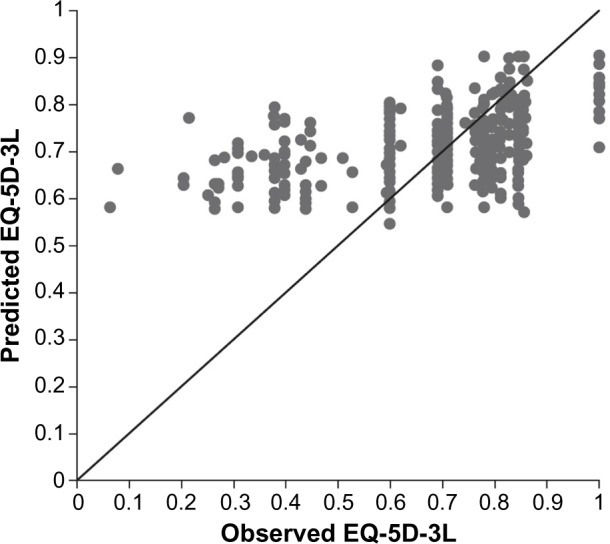
Figure 1.

Scatterplot of observed versus predicted EQ-5D-3L scores for the DER-401 cohort at baseline.
Note: Data points lying closest to the diagonal line (representing the line of perfect fit) illustrate more precise estimates of observed EQ-5D-3L scores.
Abbreviations: DER, dalfampridine extended release; EQ-5D-3L, EuroQol 5-dimension 3-level version.
